Getting Started with OpenTelemetry for Application Tracing
Getting Started with OpenTelemetry for Application Tracing
Photo by Daniil Komov on Unsplash
A user reports that the checkout page is slow. You check the application logs -- nothing unusual. You check the database metrics -- queries are fast. You check the server CPU -- normal. The problem is somewhere in the chain of service calls between the user's click and the response, but you have no way to see that chain. You are debugging a distributed system with single-service tools.
OpenTelemetry (OTel) solves this. It is a vendor-neutral standard for collecting traces, metrics, and logs from your applications. Traces show you the full path of a request across services, with timing for each step. Metrics give you aggregate measurements (request count, error rate, latency percentiles). Logs provide event-level detail. Together, they give you the observability you need to understand what your system is actually doing.
OpenTelemetry is not a monitoring platform. It is the instrumentation layer -- the data collection part. You send the data to whatever backend you choose: Jaeger, Grafana Tempo, Honeycomb, Datadog, New Relic, or any other platform that accepts the OpenTelemetry Protocol (OTLP).
Core Concepts
Traces and Spans
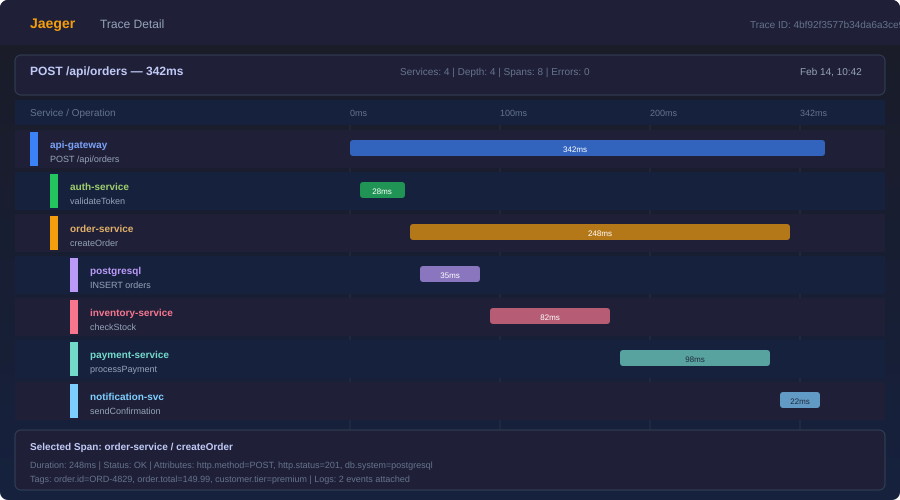
A trace represents a single request's journey through your system. It has a unique trace ID that follows the request across service boundaries.
A span is a single operation within a trace. A trace is a tree of spans. For example, a checkout request might create this trace:
checkout-request (trace root, 450ms)
├── validate-cart (50ms)
├── charge-payment (300ms)
│   ├── create-payment-intent (200ms)
│   └── confirm-payment (80ms)
├── update-inventory (60ms)
└── send-confirmation-email (40ms)
Each span has a name, start time, duration, status, and optional attributes (key-value pairs with additional context).
Metrics
Metrics are aggregate numerical measurements:
- Counter: Monotonically increasing value (total requests, total errors)
- Histogram: Distribution of values (request duration, response size)
- Gauge: Current value that can go up or down (active connections, queue depth)
Logs
OpenTelemetry logs are structured log events correlated with traces. When a log line is emitted during a traced request, it includes the trace ID and span ID, letting you jump from a log entry to the full trace.
Setting Up: Node.js / TypeScript
Install Dependencies
npm install @opentelemetry/sdk-node \
  @opentelemetry/api \
  @opentelemetry/auto-instrumentations-node \
  @opentelemetry/exporter-trace-otlp-http \
  @opentelemetry/exporter-metrics-otlp-http
Initialize the SDK
Create tracing.ts -- this must run before any other imports:
import { NodeSDK } from "@opentelemetry/sdk-node";
import { getNodeAutoInstrumentations } from "@opentelemetry/auto-instrumentations-node";
import { OTLPTraceExporter } from "@opentelemetry/exporter-trace-otlp-http";
import { OTLPMetricExporter } from "@opentelemetry/exporter-metrics-otlp-http";
import { PeriodicExportingMetricReader } from "@opentelemetry/sdk-metrics";
import { Resource } from "@opentelemetry/resources";
import {
  ATTR_SERVICE_NAME,
  ATTR_SERVICE_VERSION,
} from "@opentelemetry/semantic-conventions";

const sdk = new NodeSDK({
  resource: new Resource({
    [ATTR_SERVICE_NAME]: "checkout-service",
    [ATTR_SERVICE_VERSION]: "1.4.2",
  }),
  traceExporter: new OTLPTraceExporter({
    url: "http://localhost:4318/v1/traces",
  }),
  metricReader: new PeriodicExportingMetricReader({
    exporter: new OTLPMetricExporter({
      url: "http://localhost:4318/v1/metrics",
    }),
    exportIntervalMillis: 15000,
  }),
  instrumentations: [
    getNodeAutoInstrumentations({
      // Disable noisy instrumentations
      "@opentelemetry/instrumentation-fs": { enabled: false },
    }),
  ],
});

sdk.start();

process.on("SIGTERM", () => {
  sdk.shutdown().then(() => process.exit(0));
});
Load Tracing Before Your App
// index.ts
import "./tracing"; // Must be first!
import { app } from "./app";

app.listen(3000, () => {
  console.log("Server running on port 3000");
});
The auto-instrumentations-node package automatically instruments HTTP requests, database calls (pg, mysql, mongodb), Express/Fastify routes, and dozens of other libraries. Without writing any manual instrumentation code, you get traces for every inbound and outbound request.
Adding Custom Spans
Auto-instrumentation covers the framework layer. For application-level visibility, add custom spans:
import { trace } from "@opentelemetry/api";

const tracer = trace.getTracer("checkout-service");

async function processCheckout(cart: Cart, user: User): Promise<Order> {
  return tracer.startActiveSpan("process-checkout", async (span) => {
    try {
      span.setAttribute("user.id", user.id);
      span.setAttribute("cart.item_count", cart.items.length);
      span.setAttribute("cart.total_cents", cart.totalCents);

      // Each of these creates a child span automatically
      // if the called functions also create spans
      const validation = await validateCart(cart);
      const payment = await chargePayment(cart, user);
      await updateInventory(cart);
      const order = await createOrder(cart, user, payment);
      await sendConfirmationEmail(user, order);

      span.setAttribute("order.id", order.id);
      span.setStatus({ code: SpanStatusCode.OK });
      return order;
    } catch (error) {
      span.setStatus({
        code: SpanStatusCode.ERROR,
        message: error.message,
      });
      span.recordException(error);
      throw error;
    } finally {
      span.end();
    }
  });
}
Recording Events
Spans can contain events -- timestamped annotations within the span's lifetime:
async function chargePayment(cart: Cart, user: User): Promise<Payment> {
  return tracer.startActiveSpan("charge-payment", async (span) => {
    span.addEvent("payment.initiated", {
      "payment.provider": "stripe",
      "payment.amount_cents": cart.totalCents,
    });

    const result = await stripe.paymentIntents.create({
      amount: cart.totalCents,
      currency: "usd",
    });

    span.addEvent("payment.completed", {
      "payment.intent_id": result.id,
      "payment.status": result.status,
    });

    span.end();
    return result;
  });
}
Want more testing guides? Get guides like this in your inbox — DevTools Guide delivers one free deep-dive every week.
Custom Metrics
import { metrics } from "@opentelemetry/api";

const meter = metrics.getMeter("checkout-service");

// Counter: total checkouts
const checkoutCounter = meter.createCounter("checkouts.total", {
  description: "Total checkout attempts",
});

// Histogram: checkout duration
const checkoutDuration = meter.createHistogram("checkouts.duration_ms", {
  description: "Checkout processing time in milliseconds",
  unit: "ms",
});

// Gauge: active checkouts
const activeCheckouts = meter.createUpDownCounter("checkouts.active", {
  description: "Currently processing checkouts",
});

async function processCheckout(cart: Cart): Promise<Order> {
  const startTime = Date.now();
  activeCheckouts.add(1);

  try {
    const order = await doCheckout(cart);
    checkoutCounter.add(1, { status: "success" });
    return order;
  } catch (error) {
    checkoutCounter.add(1, { status: "error", error_type: error.name });
    throw error;
  } finally {
    activeCheckouts.add(-1);
    checkoutDuration.record(Date.now() - startTime);
  }
}
The OpenTelemetry Collector
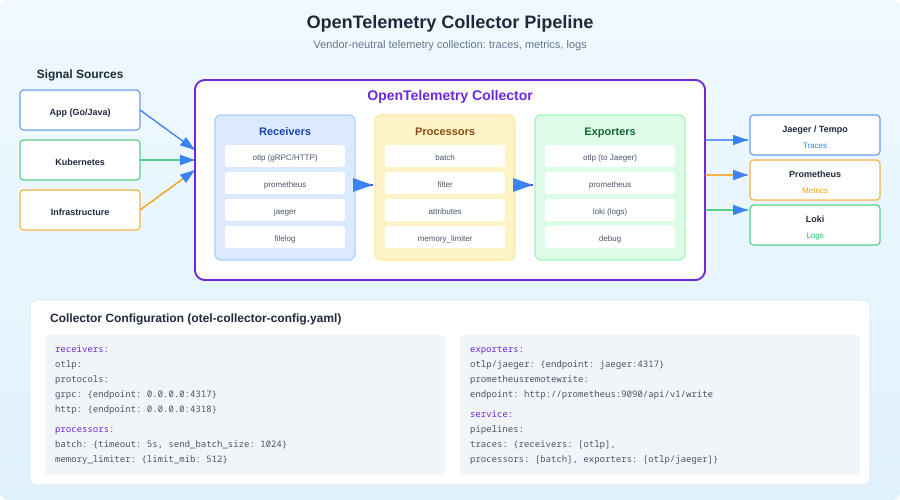
In production, you do not send telemetry directly from your application to a backend. Instead, you run the OpenTelemetry Collector as a sidecar or standalone service. The Collector receives data from your applications, processes it (batching, filtering, sampling), and exports it to one or more backends.
Why Use a Collector?
- Decouple apps from backends: Change your monitoring vendor without redeploying applications.
- Process data: Sample high-volume traces, drop noisy spans, add attributes.
- Fan out: Send traces to Jaeger AND Honeycomb simultaneously.
- Buffer: The Collector handles retries and backpressure so your app does not.
Collector Configuration
# otel-collector-config.yaml
receivers:
  otlp:
    protocols:
      http:
        endpoint: 0.0.0.0:4318
      grpc:
        endpoint: 0.0.0.0:4317

processors:
  batch:
    timeout: 5s
    send_batch_size: 1000
  memory_limiter:
    check_interval: 1s
    limit_mib: 512
  tail_sampling:
    decision_wait: 10s
    policies:
      - name: errors-always
        type: status_code
        status_code:
          status_codes: [ERROR]
      - name: slow-requests
        type: latency
        latency:
          threshold_ms: 1000
      - name: sample-rest
        type: probabilistic
        probabilistic:
          sampling_percentage: 10

exporters:
  otlp/jaeger:
    endpoint: jaeger:4317
    tls:
      insecure: true
  otlp/honeycomb:
    endpoint: api.honeycomb.io:443
    headers:
      x-honeycomb-team: ${HONEYCOMB_API_KEY}

service:
  pipelines:
    traces:
      receivers: [otlp]
      processors: [memory_limiter, tail_sampling, batch]
      exporters: [otlp/jaeger, otlp/honeycomb]
    metrics:
      receivers: [otlp]
      processors: [memory_limiter, batch]
      exporters: [otlp/jaeger]
Run with Docker Compose
# docker-compose.yaml
services:
  otel-collector:
    image: otel/opentelemetry-collector-contrib:latest
    command: ["--config", "/etc/otel/config.yaml"]
    volumes:
      - ./otel-collector-config.yaml:/etc/otel/config.yaml
    ports:
      - "4317:4317"  # OTLP gRPC
      - "4318:4318"  # OTLP HTTP

  jaeger:
    image: jaegertracing/all-in-one:latest
    ports:
      - "16686:16686"  # Jaeger UI
      - "4317"         # OTLP gRPC (internal)
Start everything with docker compose up, point your application's exporter to http://localhost:4318, and open http://localhost:16686 to see traces in Jaeger.
Context Propagation
For traces to work across service boundaries, the trace ID must travel with the request. This is called context propagation. OpenTelemetry uses the W3C Trace Context standard by default.
When your instrumented service makes an HTTP request, the SDK automatically adds these headers:
traceparent: 00-0af7651916cd43dd8448eb211c80319c-b7ad6b7169203331-01
tracestate: vendor=value
The receiving service reads these headers and continues the trace. If both services use OpenTelemetry auto-instrumentation, this happens automatically.
For message queues and async workflows, you need to propagate context manually:
import { context, propagation } from "@opentelemetry/api";

// When publishing a message
function publishMessage(queue: string, payload: unknown) {
  const carrier: Record<string, string> = {};
  propagation.inject(context.active(), carrier);

  queue.publish({
    body: JSON.stringify(payload),
    headers: carrier, // Trace context travels with the message
  });
}

// When consuming a message
function consumeMessage(message: QueueMessage) {
  const parentContext = propagation.extract(
    context.active(),
    message.headers
  );

  context.with(parentContext, () => {
    tracer.startActiveSpan("process-message", (span) => {
      // This span is a child of the publishing span
      processPayload(message.body);
      span.end();
    });
  });
}
Sampling Strategies
In production, tracing every request generates enormous data volumes. Sampling reduces this to a manageable level.
Head sampling: Decide at the start of a trace whether to record it. Simple and low-overhead, but you might miss interesting traces.
import { TraceIdRatioBasedSampler } from "@opentelemetry/sdk-trace-node";

// Sample 10% of traces
const sampler = new TraceIdRatioBasedSampler(0.1);
Tail sampling (via Collector): Decide after the trace completes. This lets you keep 100% of error traces and slow traces while sampling routine traffic. Requires the Collector to buffer traces temporarily.
Adaptive sampling: Adjust the sampling rate based on traffic volume. High-traffic services sample less; low-traffic services sample everything.
The practical recommendation: start with 100% sampling in development and staging. In production, use tail sampling via the Collector to keep all errors and slow requests, and probabilistically sample 5-20% of everything else.
Choosing a Backend
OpenTelemetry's vendor-neutral design means you pick the backend that fits your needs:
Jaeger (free, self-hosted): Good for teams that want full control. Stores traces in Elasticsearch, Cassandra, or Badger. The UI is functional but basic. Best for teams already running Elasticsearch.
Grafana Tempo (free, self-hosted): Trace backend that integrates with the Grafana stack. If you already use Grafana for dashboards, Tempo is the natural choice. Uses object storage (S3, GCS) which keeps costs low at scale.
Honeycomb (SaaS): The best query experience for traces. Their "BubbleUp" feature automatically surfaces anomalies. Expensive at scale but exceptional for debugging complex distributed systems.
Datadog/New Relic (SaaS): Full-platform observability with traces, metrics, logs, and more. The advantage is everything in one place. The disadvantage is cost and vendor lock-in.
SigNoz (free, self-hosted or SaaS): Open-source alternative to Datadog. Supports traces, metrics, and logs with a unified UI. Good middle ground between Jaeger and commercial platforms.
Common Pitfalls
Forgetting to end spans: An unended span leaks memory and produces malformed traces. Always use try/finally or the callback form of startActiveSpan.
Too many spans: Instrumenting every function creates noise. Focus on operations that cross boundaries (HTTP calls, database queries, message queue operations) and significant business operations (checkout, payment, notification).
Missing service.name: Without a service.name resource attribute, your traces show up as "unknown_service" in every backend. Always set it.
Not propagating context through async boundaries: If you use worker threads, message queues, or setTimeout, the trace context is lost unless you explicitly propagate it.
Ignoring the Collector: Sending telemetry directly from applications to backends works in development but creates tight coupling in production. Use the Collector.
Conclusion
OpenTelemetry is the standard for application instrumentation. It replaced a fragmented landscape of vendor-specific agents (Datadog APM, New Relic agents, Jaeger clients) with a single, vendor-neutral SDK that works with every backend. The investment you make in OpenTelemetry instrumentation is portable -- switch backends without changing application code.
Start with auto-instrumentation, add custom spans to your critical business paths, run the Collector for processing and routing, and pick a backend that fits your budget. You will wonder how you ever debugged distributed systems without traces.